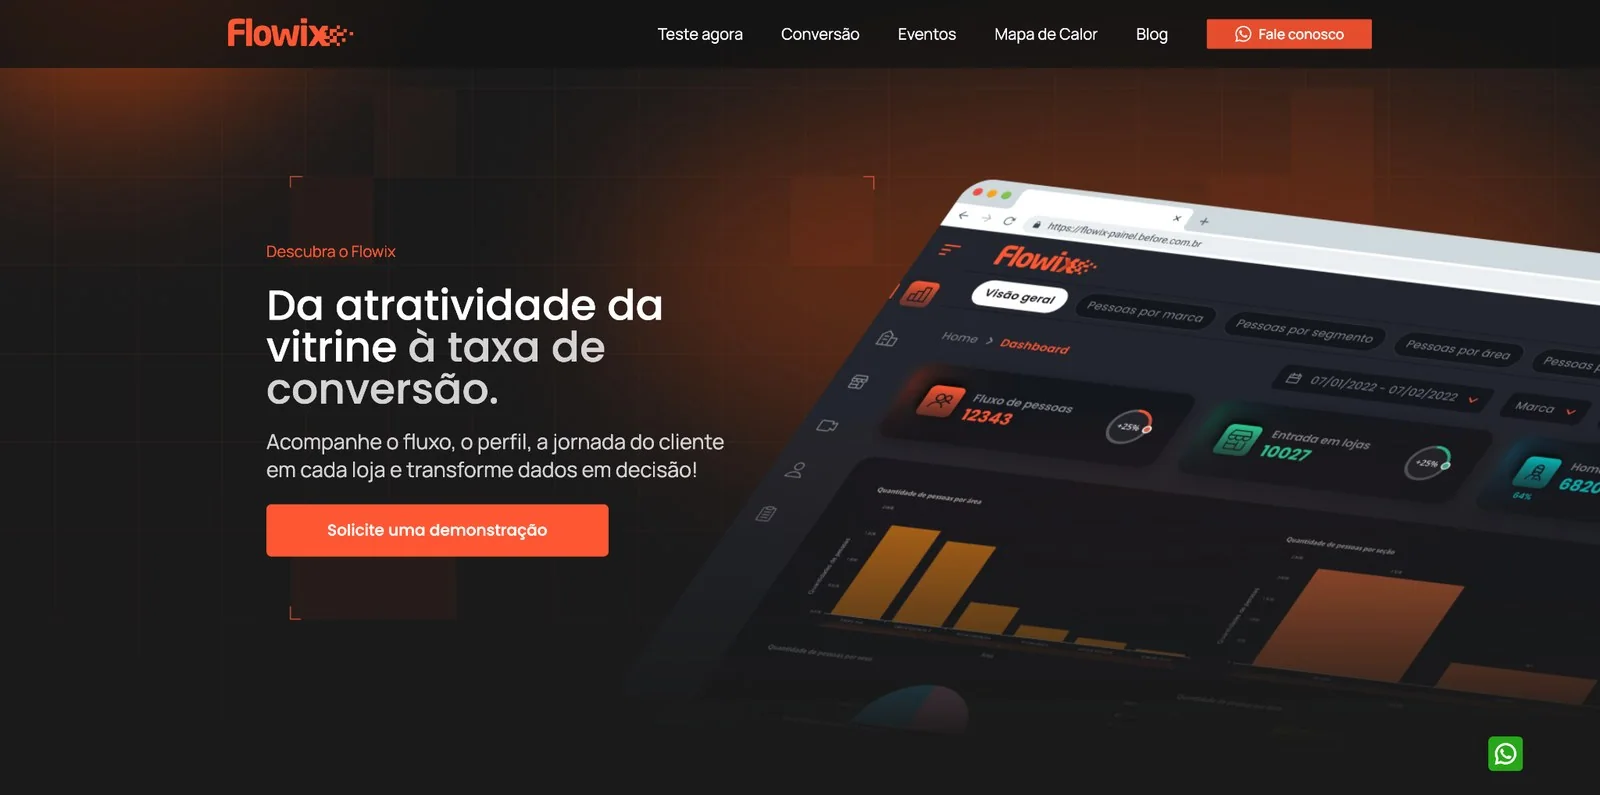
Decision-oriented dashboard
Traffic, entries, profile and behavior were organized into a visual hierarchy that enables quick scanning and progressive detail.
A platform that combines artificial intelligence and cameras already installed at the point of sale to turn physical behavior into strategic retail data.
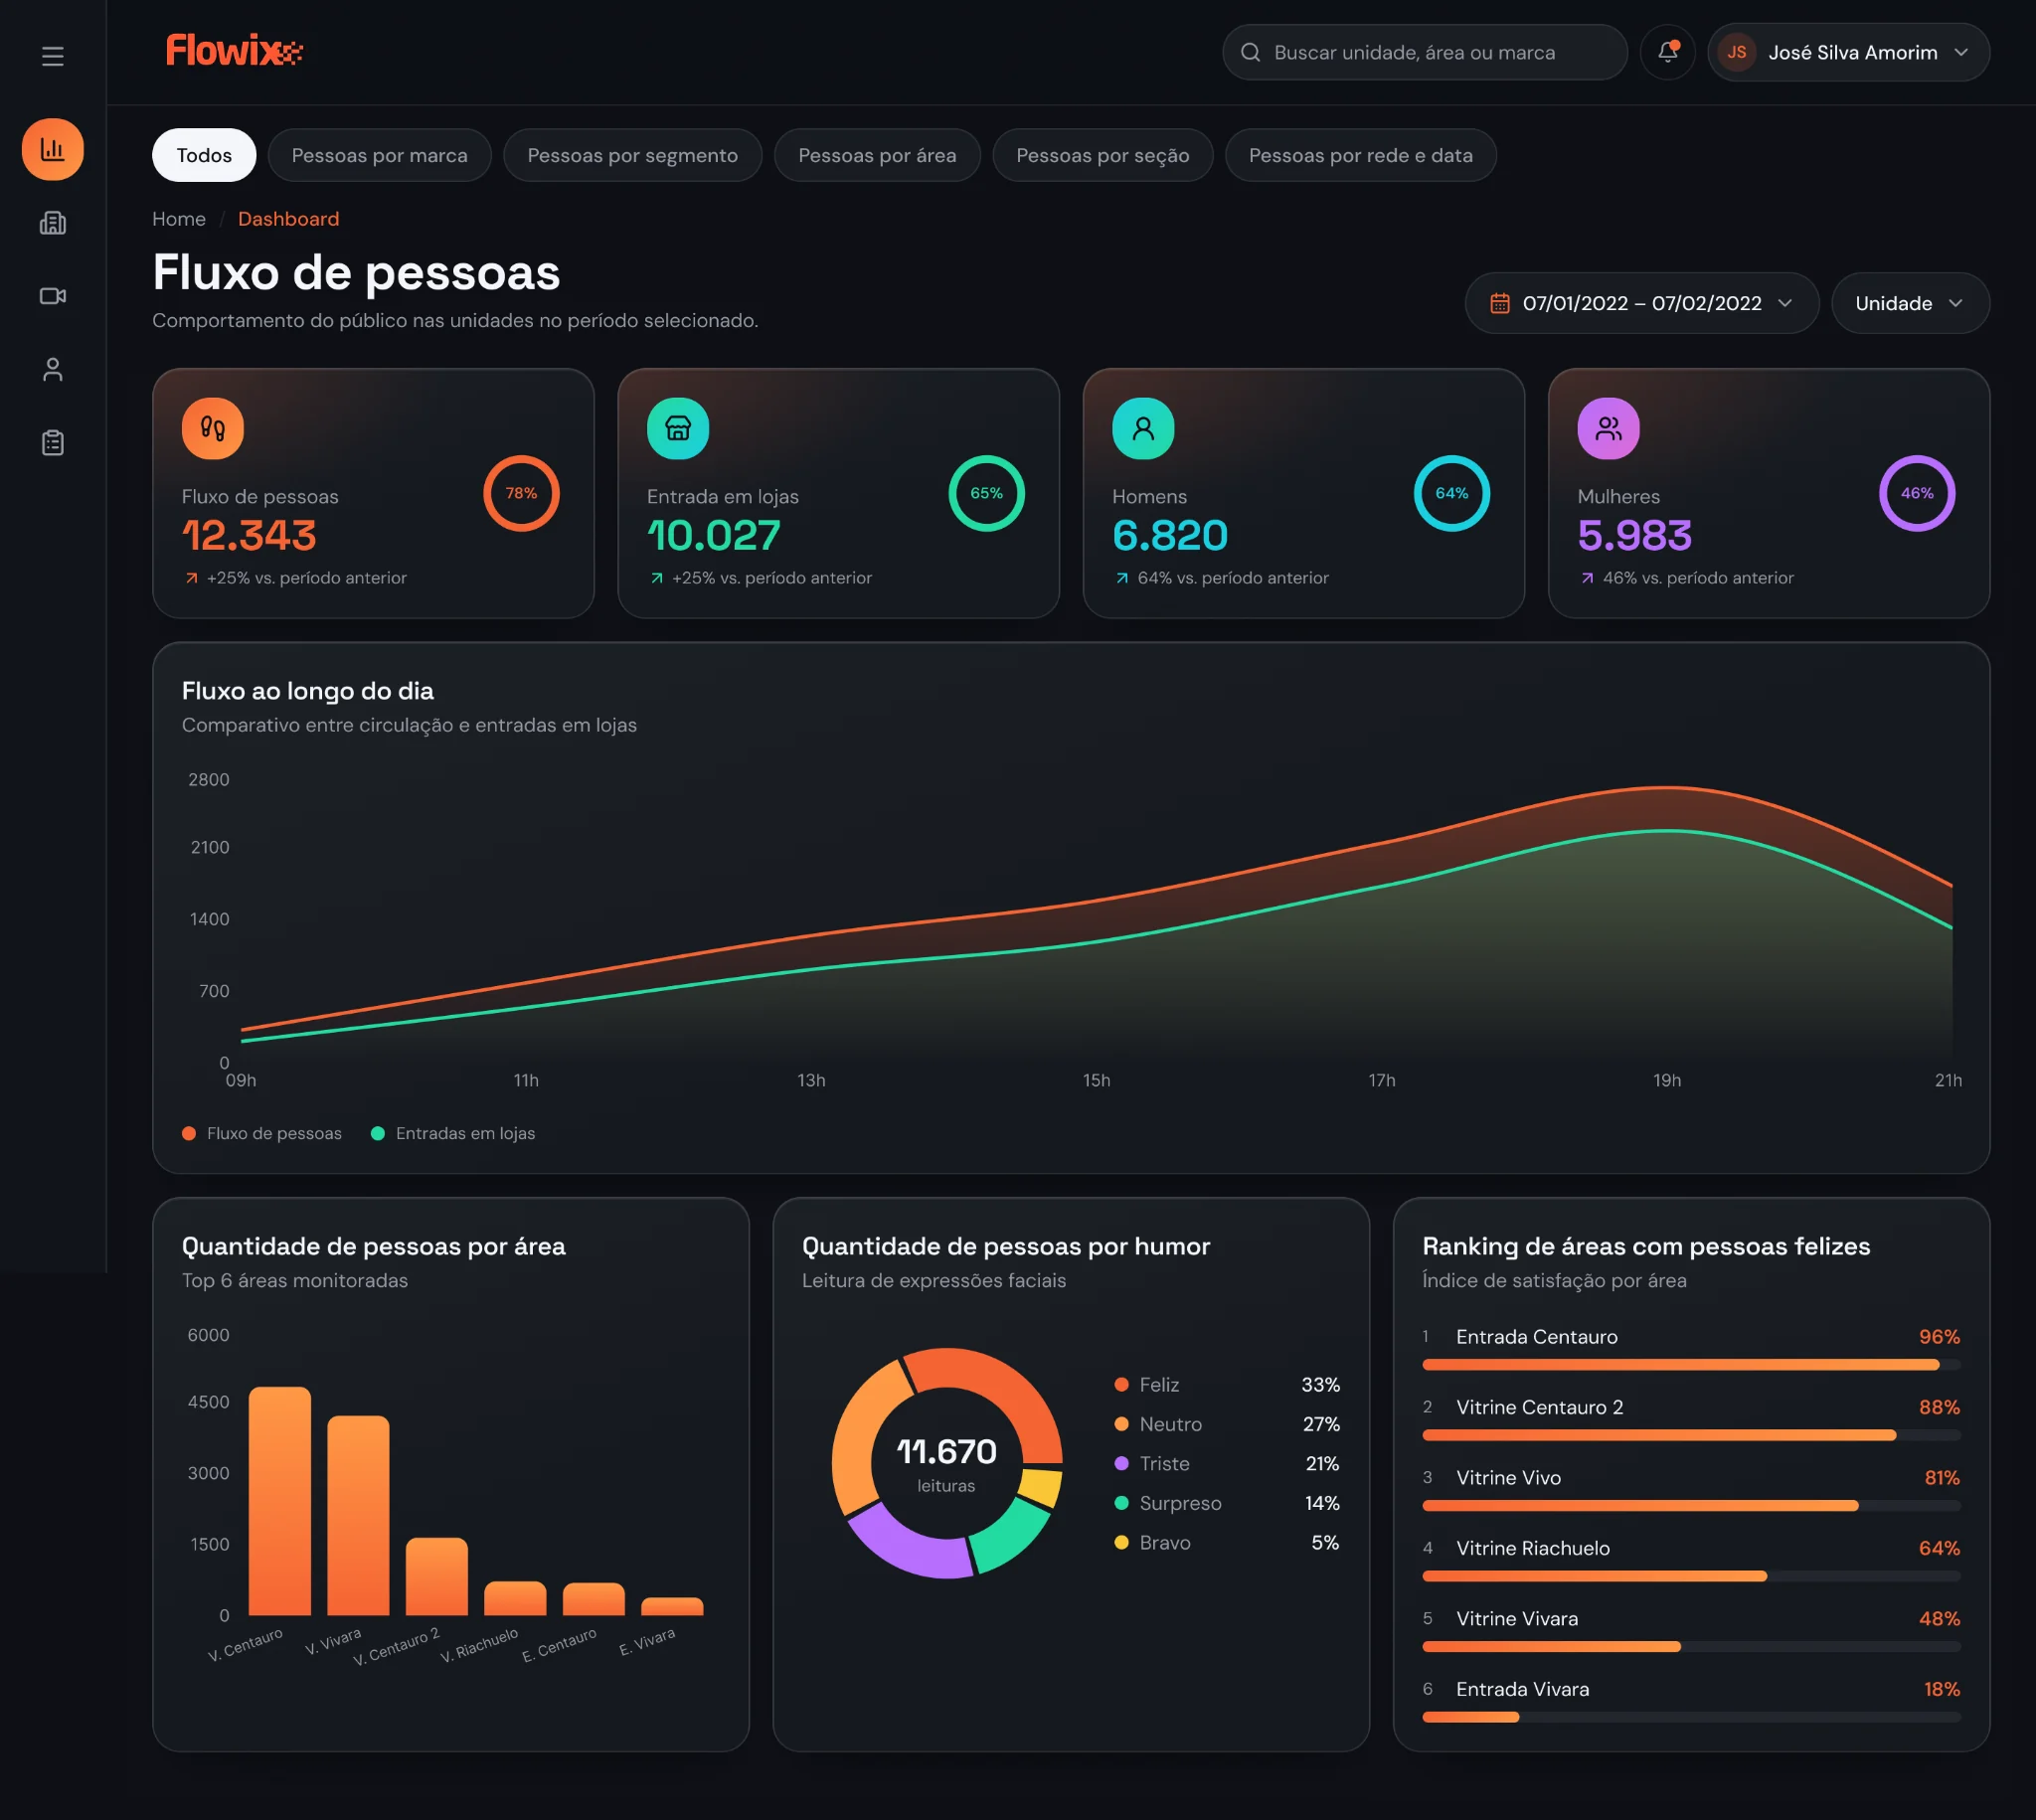
Flowix could identify foot traffic, store entries, audience profile, behavior and area performance. The UX challenge was to organize this information so managers could quickly understand what was happening in the physical space.
Multiple indicators from computer vision could create information overload and make business interpretation harder.
Prioritize information that answers users' main questions and supports decisions about operations, layout and service.
Traffic, entries, profile and behavior were organized into a visual hierarchy that enables quick scanning and progressive detail.
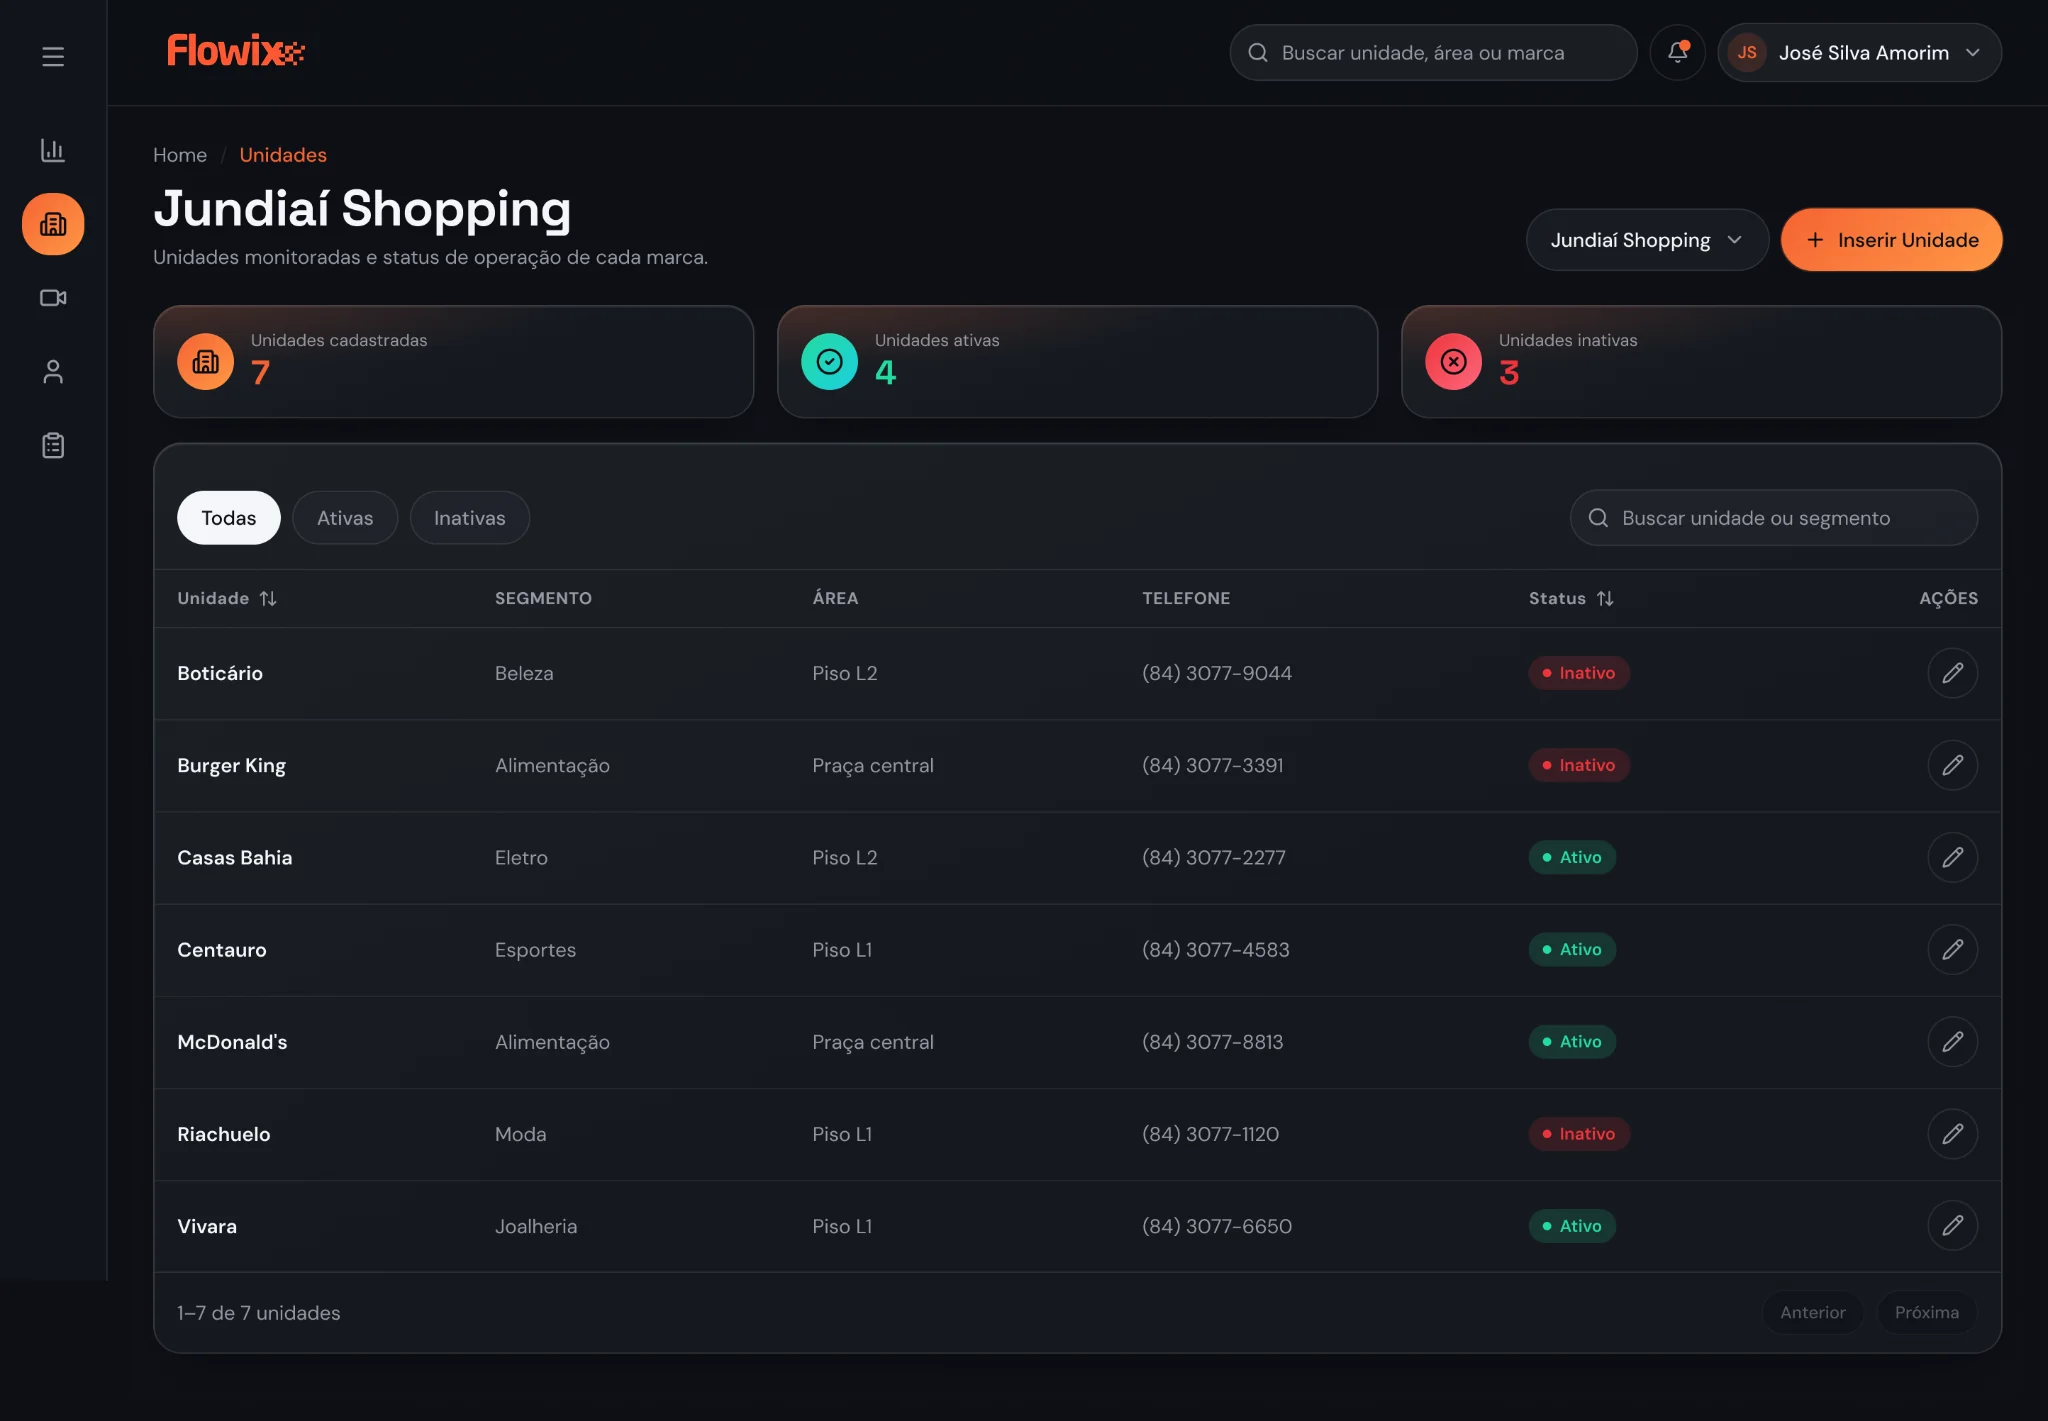
The platform also needed to support multiple stores, allowing teams to create, edit and track active and inactive locations in one environment.
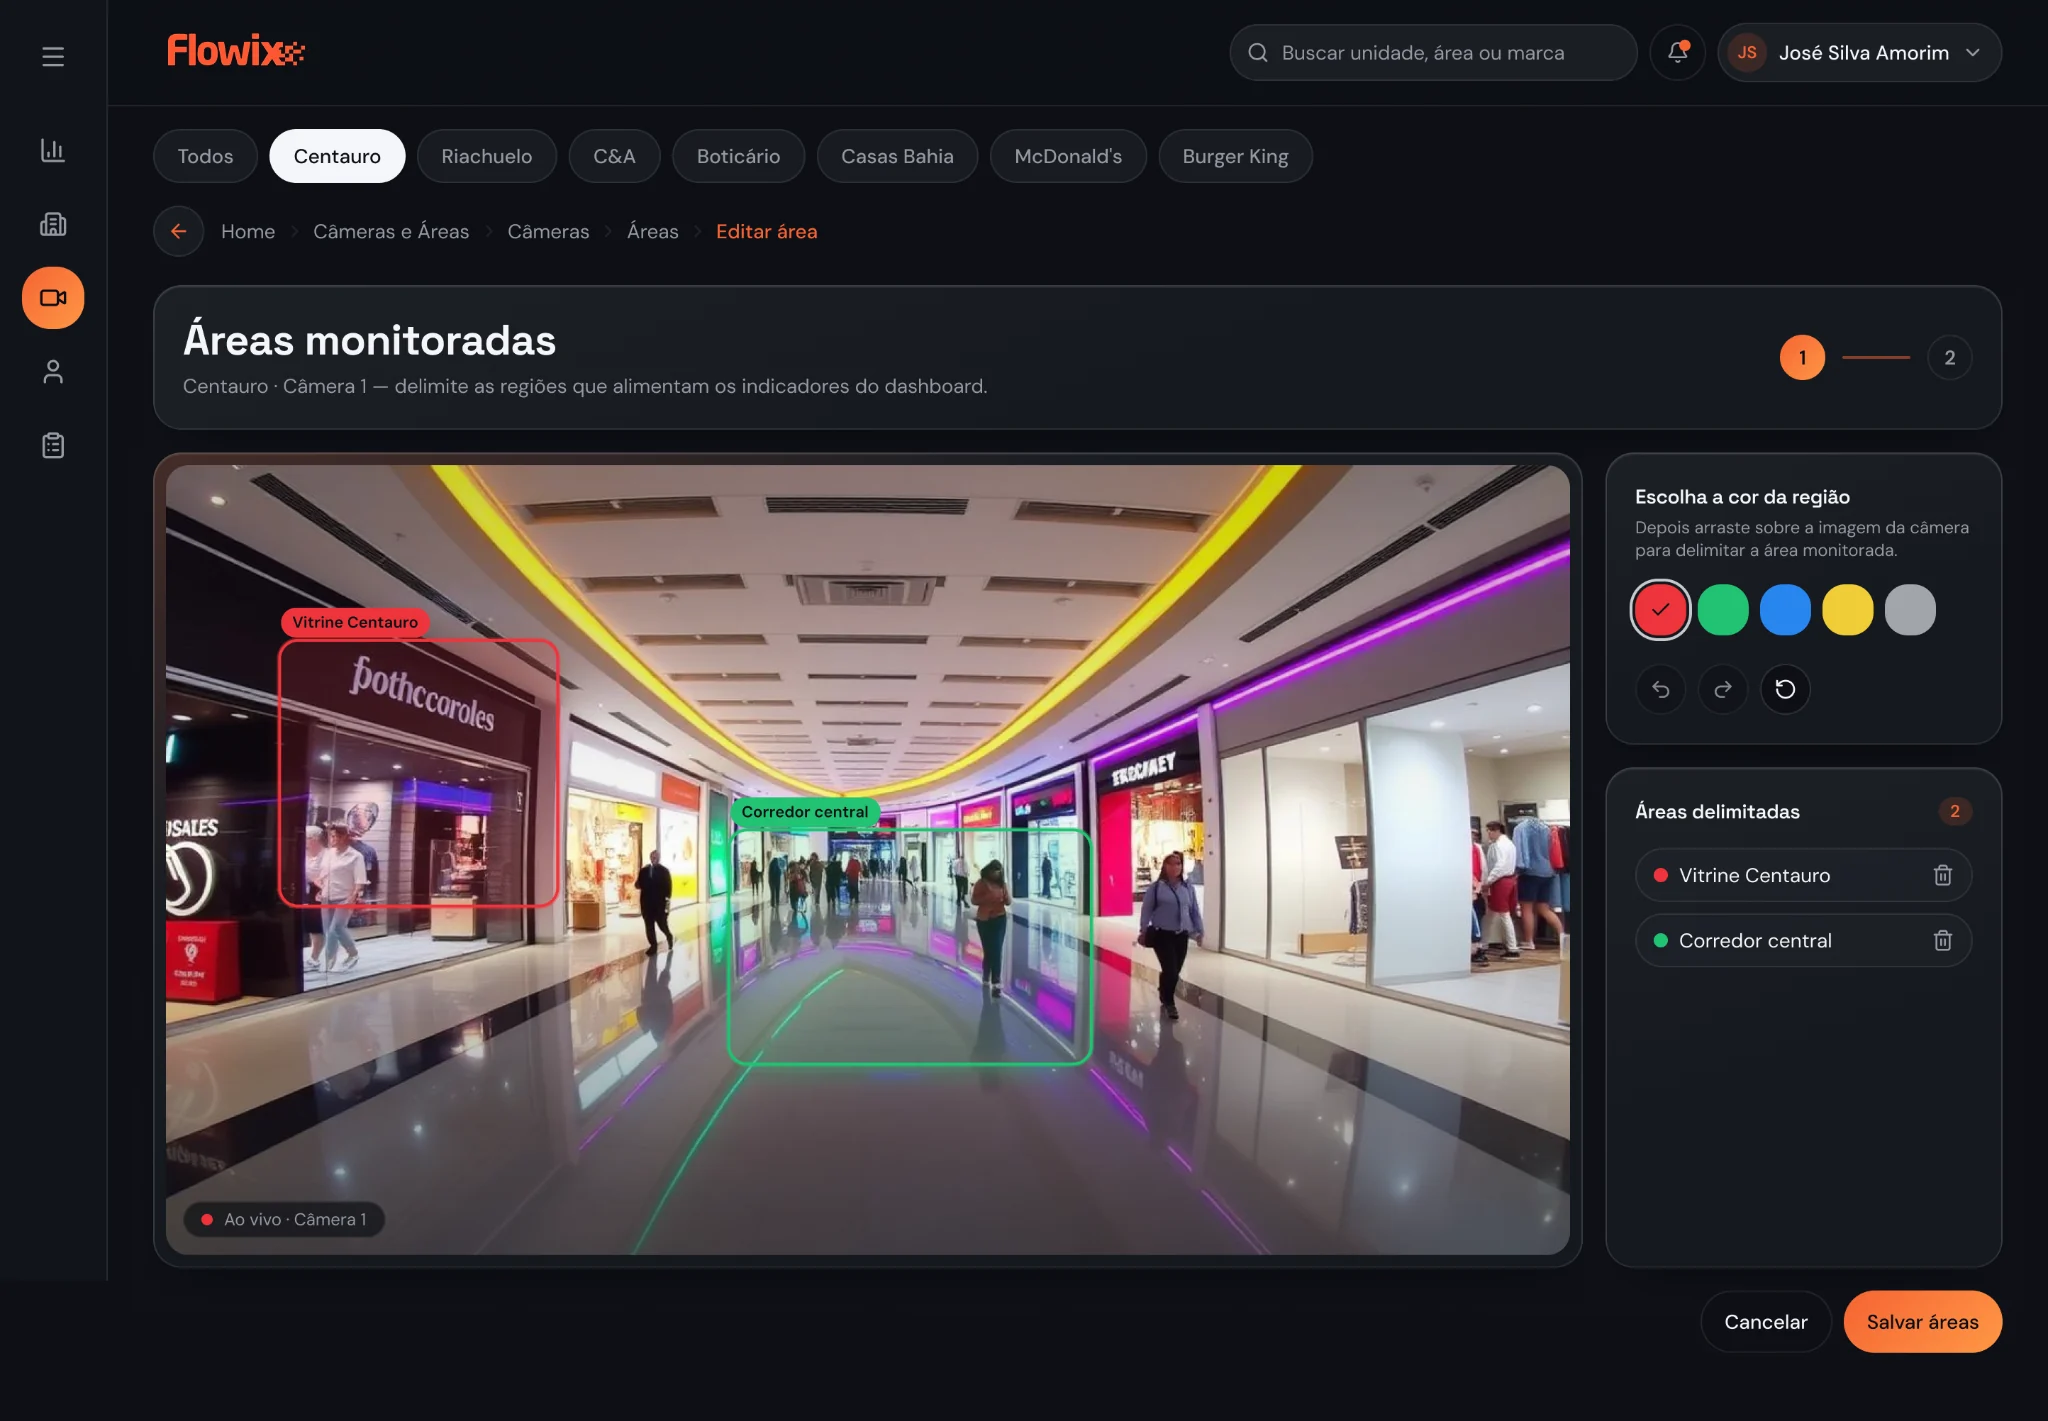
Users can define directly on the camera image which regions they want to monitor, connecting the physical space to dashboard indicators.
Flowix turns what happens in the physical space into information that helps managers identify patterns, opportunities and next steps.